What is the difference between Efficiency, Capacity factor, and Performance Ratio of Solar PV system?

During a recent conversation with my colleague, he asked about the different indicators used to evaluate Solar PV systems. He mixed up several terms like efficiency (of PV modules), performance ratio, and capacity factor. This confusion sparked my idea to write this article.
I understand why it can be confusing to distinguish between these indicators related to Solar PV systems. It’s not only my colleague who noticed this confusion; I have encountered this mix-up several times. Although these indicators mean different things, they are all dimensionless and given as a percentage, which adds to the confusion.
Look at the following list of percentages. Which do you think are the most probable numbers for efficiency, capacity factor, and performance ratio?
A) 85.5%
B) 21.3%
C) 16.7%
NOTE: These are the relevant percentages for July 2024. Who knows what new CP and PV cell efficiencies will be achieved.
.
.
.
If you said that A is the performance ratio, B is the efficiency of the PV module, and C is the capacity factor, you can differentiate between these indicators. If you made a mistake, keep reading, as I will explain each indicator in detail.
For demonstration, let’s do a simple simulation on PVsyst and see what is what based on a PVsyst simulation.
Simulation
For simplicity, let's do the calculations for a 100 kW system. We will use PVsyst to simulate the simplest layout with some components. The detailed report can be downloaded from here:
Some details of simulated system:
- PV System size: 100 kW
- Location: Saatli, Azerbaijan
- PV panel's rated power: 500 W
- Number of PV modules: 200 units
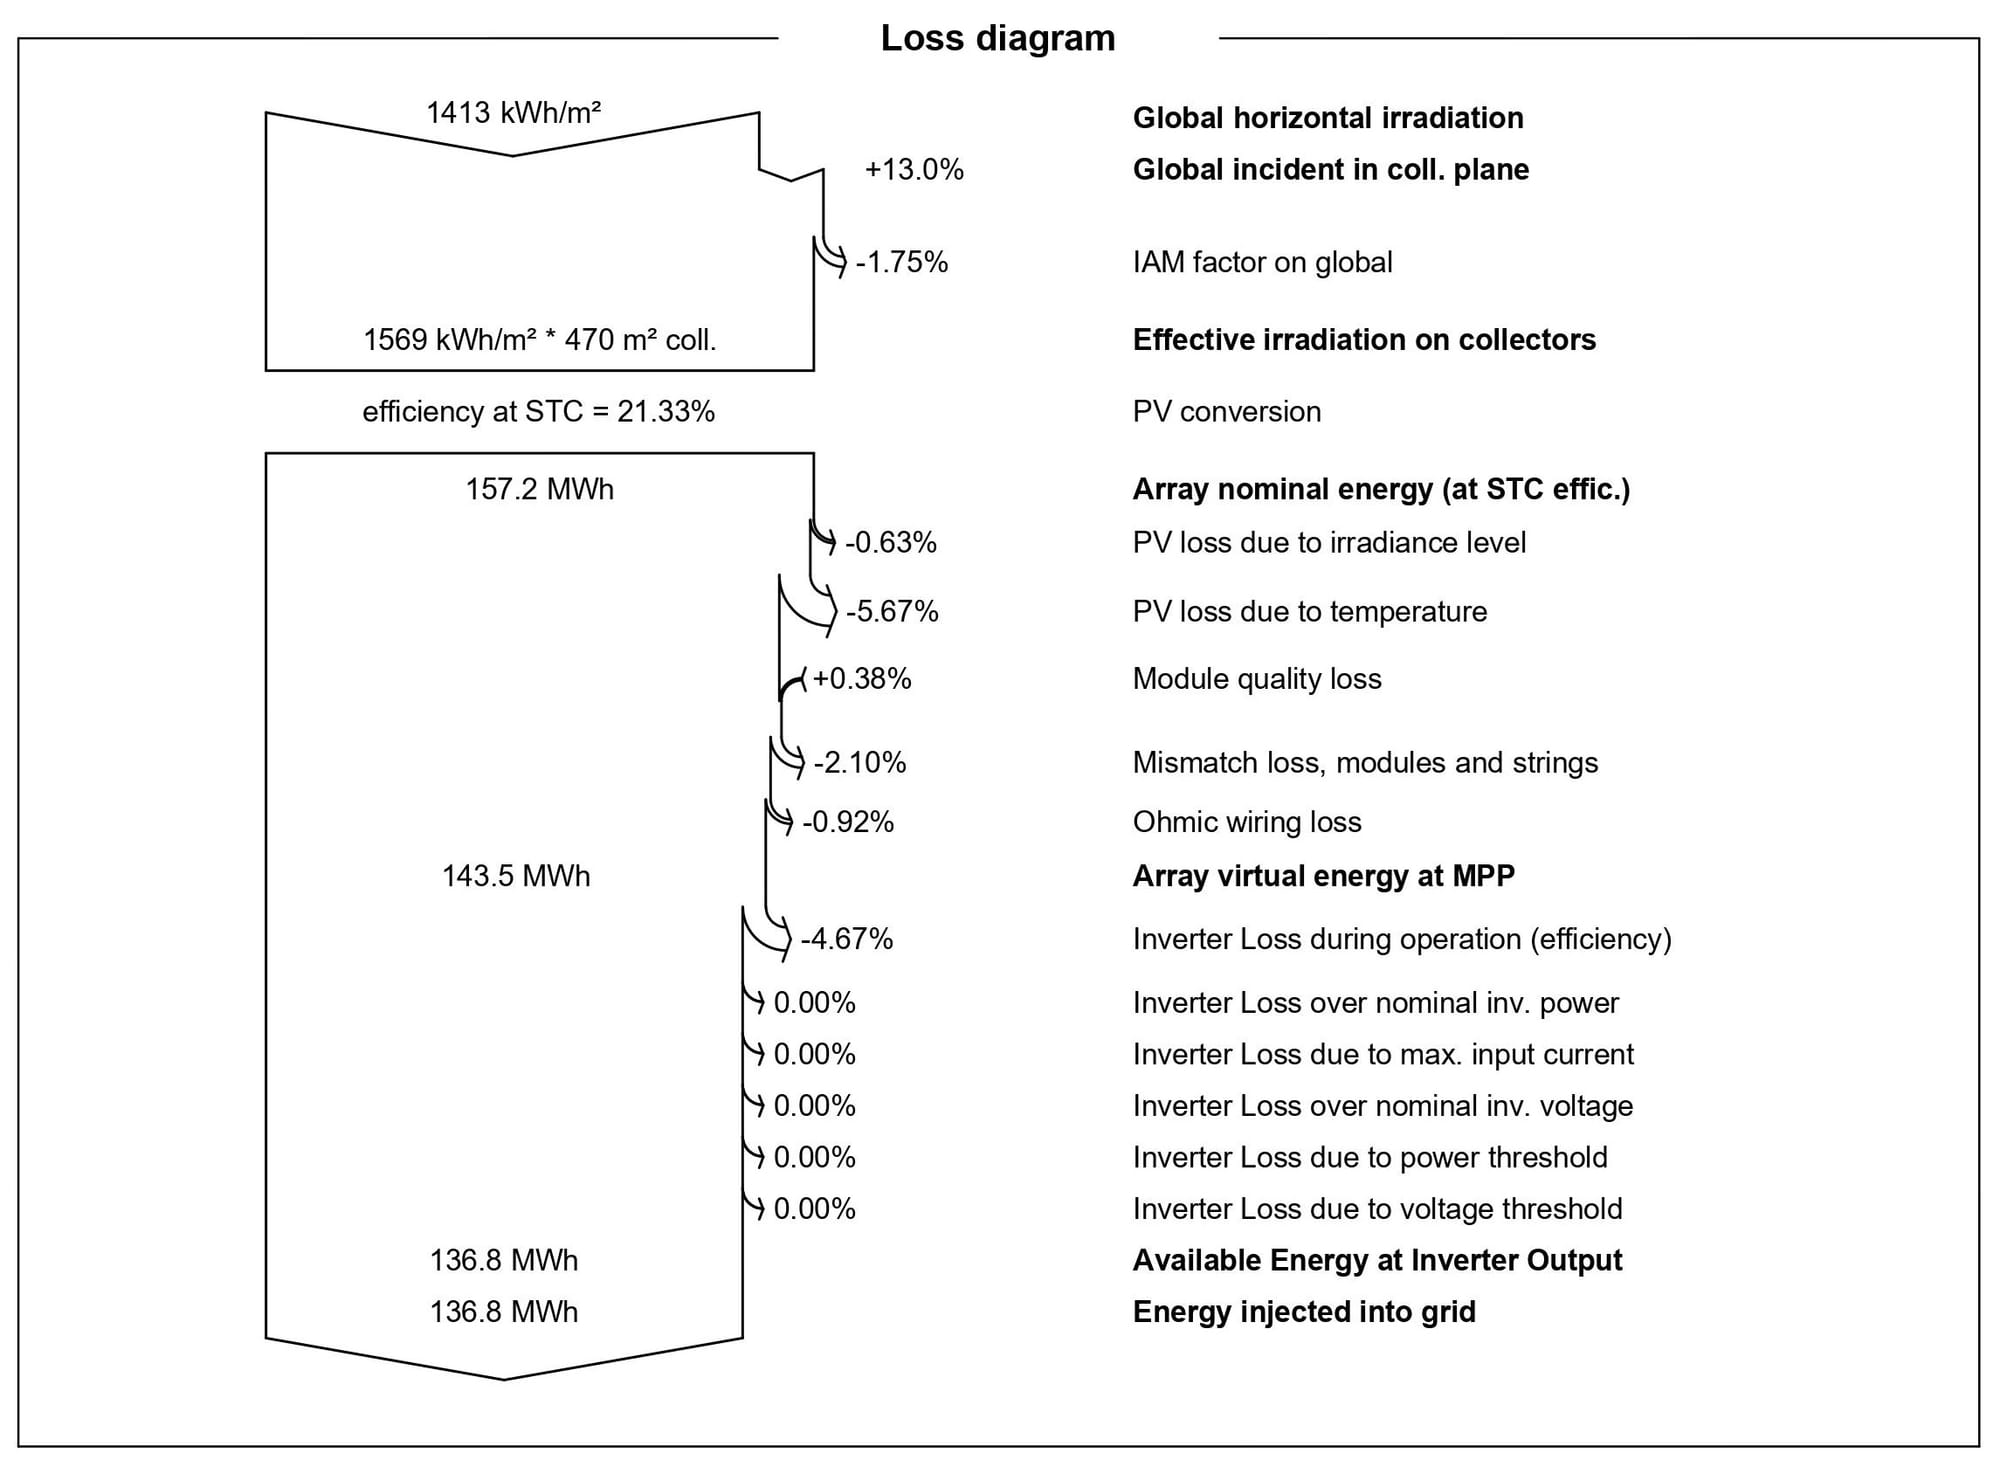
- Annual energy yield: 136,766 kWh
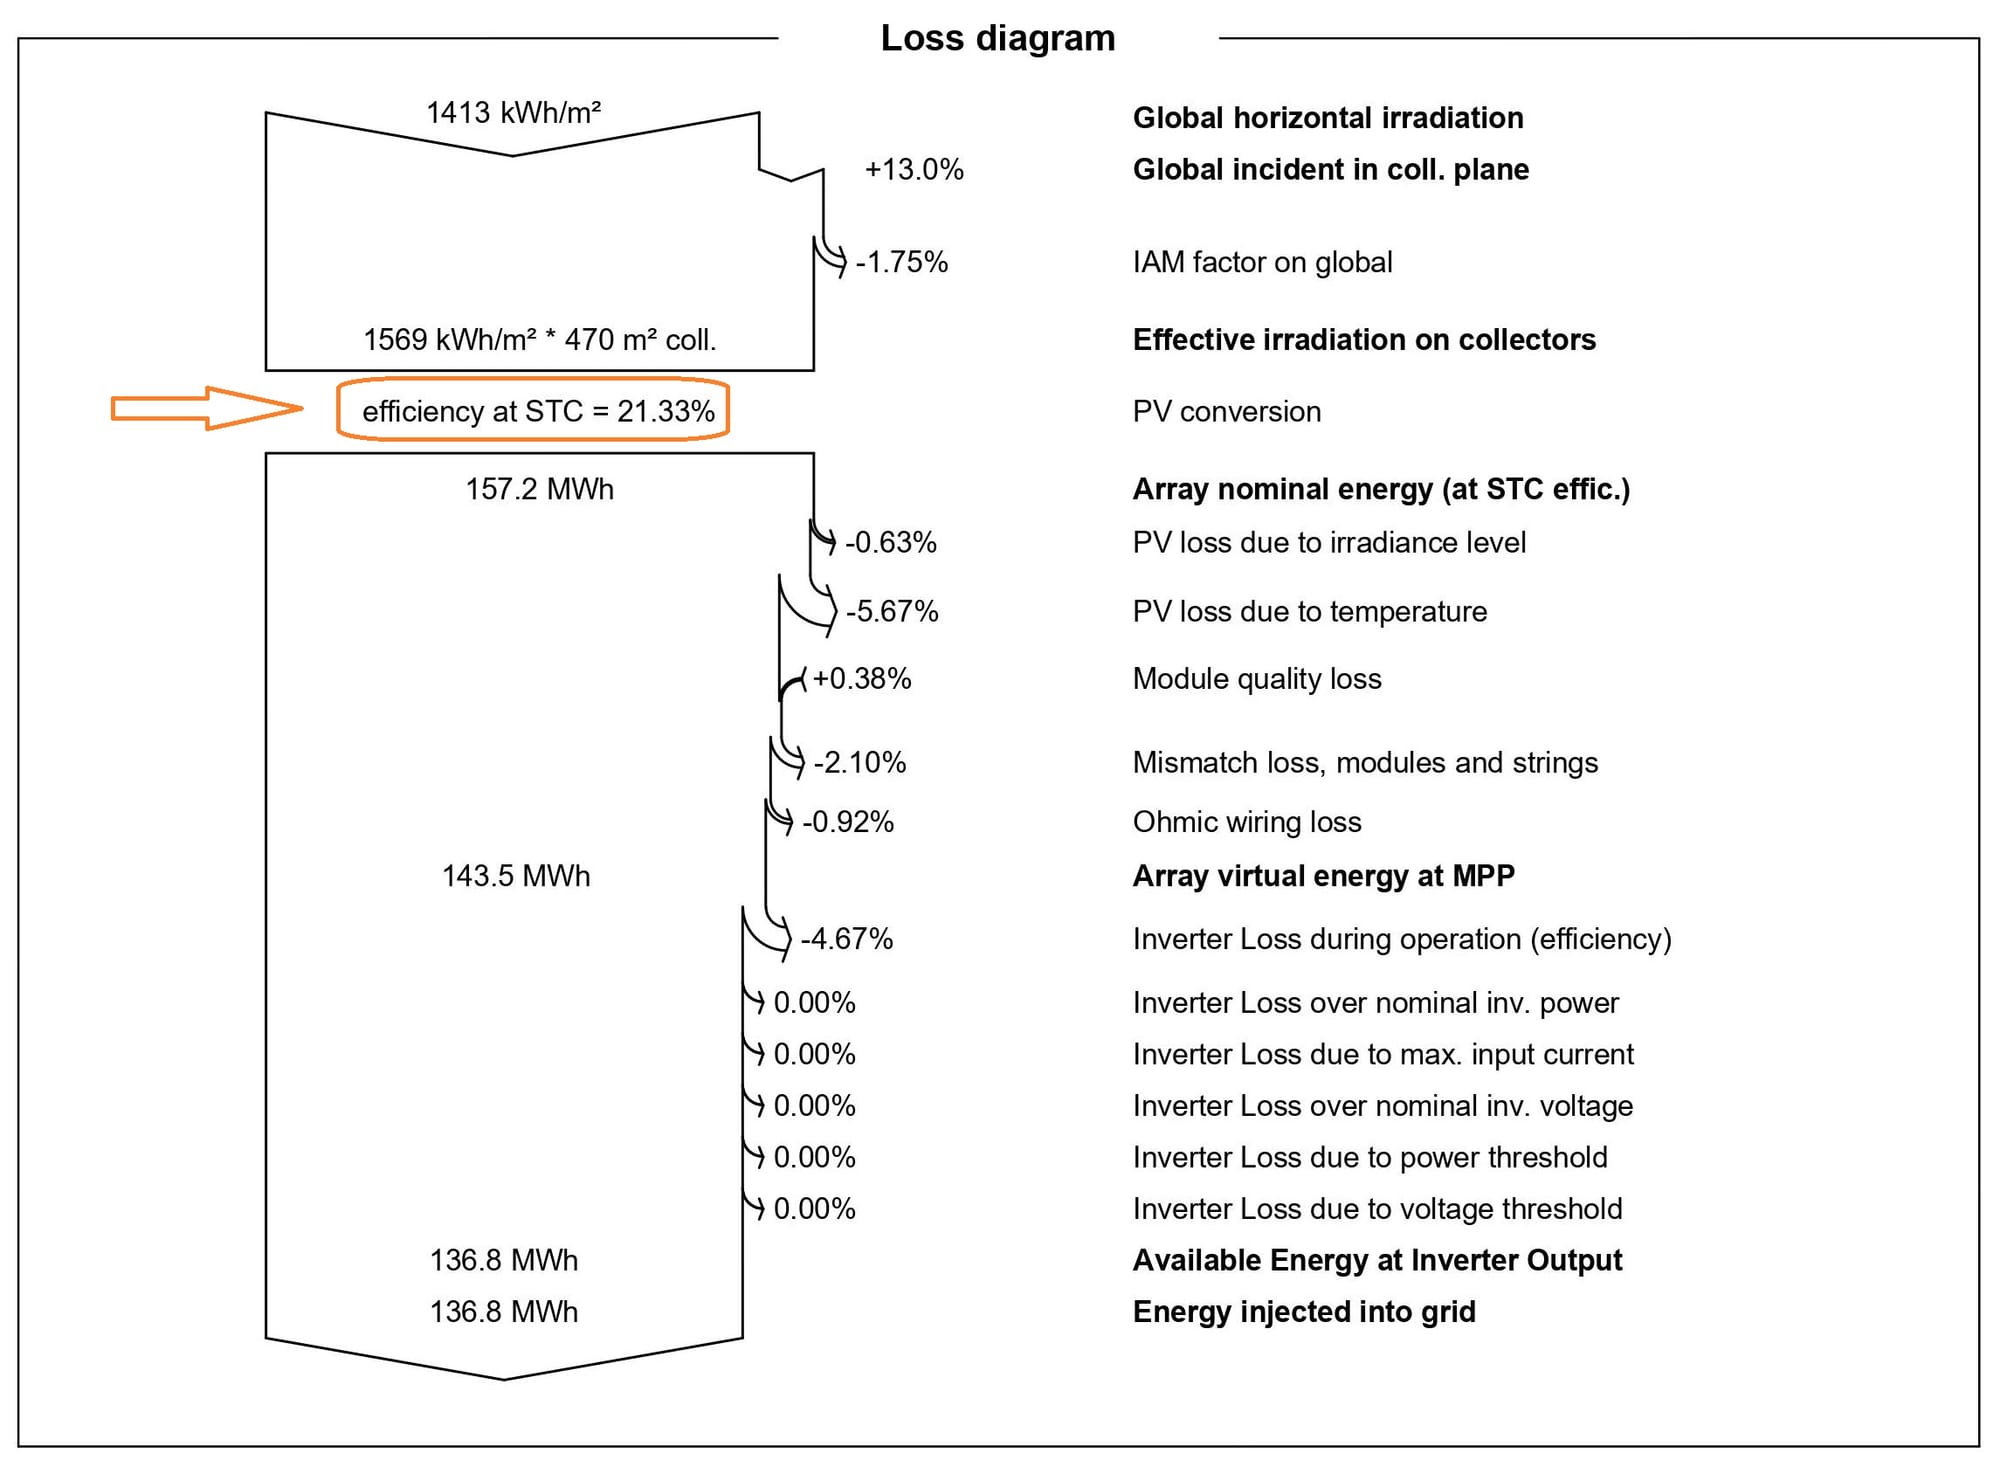
- Efficiency of PV module: 21.33%
- Performance Ratio: 85.66%
- Capacity Factor: 15.62% (manually calculated)
What’s most relevant for the topic of this article is the loss diagram, which shows the steps PVsyst used to determine the final amount of energy injected into the grid and the loss factors considered in this simulation. Since this is a simple calculation, I tried to minimize the complexity of the simulation by reducing almost all relevant losses. Here is the loss diagram I will reference in this article:

Efficiency of PV panels
Efficiency of PV panels refer to the percentage of sunlight that can be converted into usable electricity. Higher efficiency means more power output for the same amount of sunlight. It is calculated by dividing the amount of electricity a PV panel produces over a certain period of time (electrical output, P_out) by the amount of solar energy the panel receives during the same period (solar energy input, P_in). Simply put, the formula is:

In PVsyst (and in any PV system simulation software you will use), efficiency is not calculated but referenced from the PV module's technical sheet. It's mentioned here in the loss diagram:

Let's double-check it:

Quite close! The 0.01% difference is due to rounding numbers.
While the efficiency of PV panels is an interesting topic, it doesn't come up often in actual projects. This is because panel efficiency is mainly a subject of Research and Development departments of PV manufacturers. Most modern PV modules have similar efficiency ranges. Additionally, the solar energy input (P_in) is free, so it’s not a primary concern for most project developers. What comes up more frequently in regular conversations about Solar PV projects are the Capacity Factor and Performance Ratio.
Capacity Factor
While the efficiency of a PV module shows the percentage of solar energy converted into electricity, the capacity factor of PV plant shows the actual annual energy yield relative to the maximum theoretically possible output over a year. It is calculated as the ratio of the Annual Energy Yield of PV plant to the Maximum Possible Output (that assumes the plant operates at full capacity for 24/7). The formula for capacity factor is:

Capacity factor is a common indicator for all types of power plants, including coal, gas, nuclear, wind, and solar. Typical capacity factors vary widely among different types of power plants. For instance, nuclear power plants often have a capacity factor of around 90%, coal plants around 70%, and wind farms about 30-40%. Solar PV plants usually have lower capacity factors, typically ranging from 15% to 25%. (citation needed? but you can google it 😄)
But why is the capacity factor of a PV plant lower compared to other types of power plants? Several reasons:
- Solar panels only generate electricity during the day when there is sunlight (which removes at least 50% from the maximum possible output)
- The generation is not uniform throughout the day or year, as the sunshine is not uniform throughout the day or year. It depends on factors like weather conditions (rainy days, cloudy days, etc.), season (summer is sunnier than winter) and the position of the sun (noon is sunnier than morning/evening)
- Losses such as shading, soiling, and temperature effects further reduce the effective output.
Lower capacity factor of a Solar PV plant is neither good, nor bad. It is simply a characteristic of solar PV plants. While we cannot do anything about the first and second factors, we can work on the third factor to improve the capacity factor. Efforts to reduce losses include regular cleaning of the panels to prevent soiling, strategic placement and design to minimize shading, and using high-quality materials that perform well under various temperature conditions. Additionally, using advanced technologies like bifacial panels, tracking systems, and optimizing the tilt and orientation can also help maximize the energy yield and improve the overall capacity factor.
Let's calculate the capacity factor for our simulated 100 kW PV system. According to our simulation, the annual energy yield is 136,766 kWh. The maximum possible output for a 100 kW system running 24/7 all year would be:

Using these values, the capacity factor is:

One thing to note is that PVsyst does not directly reference capacity factor in its reports. This is why I usually calculate it myself. Other design software might include this calculation in their reports, but as you see, it’s not so hard to calculate manually.
Performance Ratio
How great it would be if we didn't have any losses. It would be so simple and easy... But we do not live in an ideal world. However, we can still calculate how much an "ideal" energy yield would be in a solar PV system by not taking into account any losses that our simulation has considered. We just need to multiply the amount of solar energy our PV panels receive (Global Tilted Irradiation, GTI) by the total size of our system (P_nom):

This "ideal" energy yield represents the output under Standard Test Conditions (STC), which means the panels receive irradiance of 1000 W/m², the panel temperature is 25°C, and the air mass 1.5 (AM 1.5) spectrum. (source)
However, building a solar PV system is not like solving a physics problem where we can "assume no friction, no air resistance, no internal resistance, all gas is an ideal gas, all fluid flow is laminar, e = 3, pi = 3...." Simply put, we must consider losses but try to minimize their negative impact as much as possible. This is where the Performance Ratio (PR) helps us, as it reflects the "technical quality" of the PV system by accounting for losses like shading, temperature effects, and system inefficiencies. It shows how well we manage to avoid losses. If PR is between 70% and 85% (or higher), we are doing well. If PR is low... "Houston, we have a problem."
Performance ratio is calculated by dividing the actual energy that our system fed into the grid by the "ideal" energy yield. The formula is:

Let's see how PR is calculated in PVsyst. According to our simulation, the annual energy yield is 136,766 kWh. Then:

According to the report, the simulation value for PR is also 85.66%. PERFECTO!
An interesting fact: while efficiency and capacity factors can never be more than 100%, PR can reach values higher than 1 (under certain circumstances). For more detailed information on how it's possible, please read my previous article: Is it possible to have PR > 1?.
It’s also important to note that PR indicates only the "technical quality" of a PV system. Sometimes, systems are designed to take advantage of financial incentives during specific times of the day or season, rather than to maximize annual energy production. At the end of the day, it is all still about money. Therefore, PR should be used to compare similar PV systems in similar areas and under similar conditions. Under these conditions, PR makes it a good comparative indicator when evaluating the performance of different systems.
Conclusion
In summary:
- Efficiency of PV panels refers to the percentage of sunlight that can be converted into usable electricity by the PV panels. Usually around 19-21%.
- Capacity Factor measures the actual annual energy yield of a PV system relative to its maximum possible output if it operated at full capacity 24/7. Usually around 15-25%.
- Performance Ratio (PR) is a measure of the technical quality of a PV system, accounting for all losses. It compares the actual energy output to the theoretical "ideal" energy yield. Usually around 70-85%.
Whether you are a project developer, engineer, or investor, knowing these indicators (how to interpret them and what indicators are important to focus on) will help you to evaluate and compare Solar PV systems more effectively. And of course, this knowledge will help you avoid confusion between these indicators 😄